Today, our goal is to deploy a simple application for cluster resources monitoring. Target resources will be CPU charge, Memory consuming, CPU temperature and pods state like in Top view on Linux system.
Project stack
Application
It's a Java Maven multi-module project, source code available here:
- Core module for communication with Cluster API server using Kubernetes Java Client.
- Service module to expose Rest services using Spring Boot and Spring Rest component.
- Webapp module to make a web application based on ReactJs Framework with Material-UI Framwork.
Metrics
With default install of Kube, we don't have some metrics like CPU and consumed Memory of node, so we will deploy a Metrics Server with our image built for arm-V7 architecture. Metrics server deployment source code available here.
Temperature sensor
To track CPU Temperature of every node, we will deploy a very small pod and use the "/sys/class/thermal" of pod who be inherited from host.
Fan commander
To manage Fan, we will use GPIO utilities of Python RPi library.
Material
Fan
We have a tower for all worker node (north, south, east and west) with a single fan connected to west node (because it's in the top of the tower)
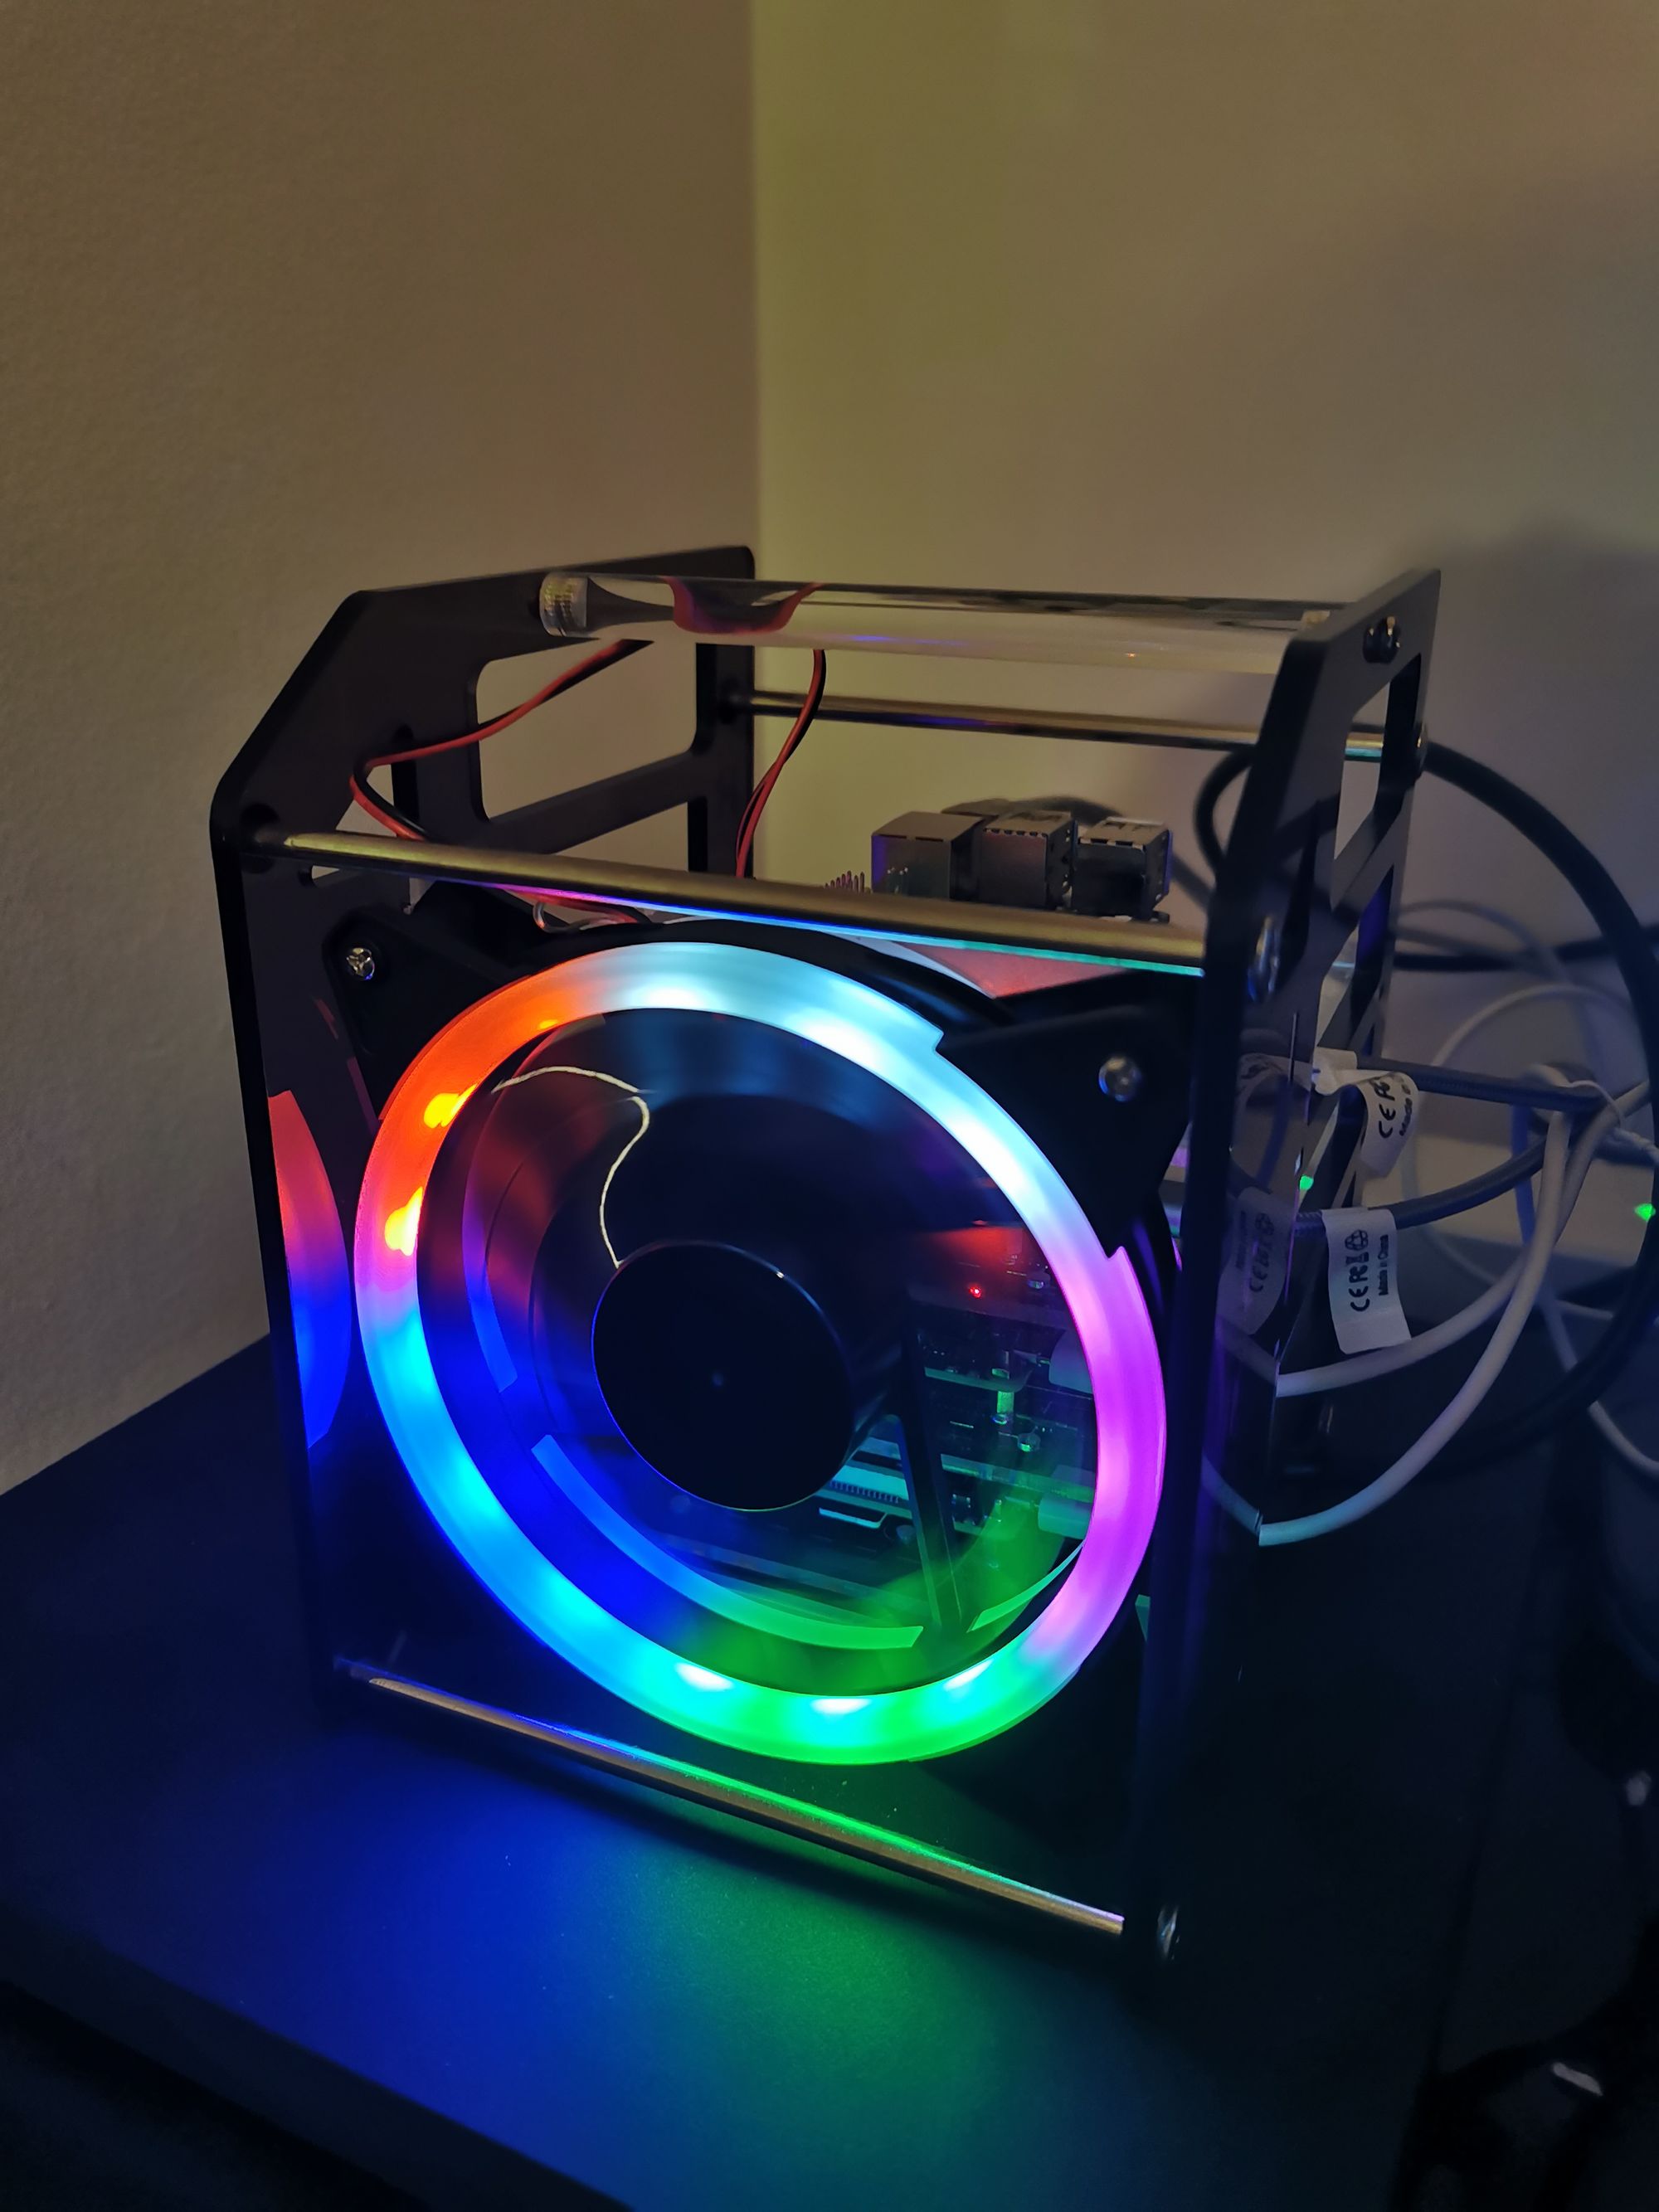
Chipset
To manage fan, we will use a single chipset L293D from Texas Instruments. This chipset allows us to pilot 2 motor with DC power (rotation direction and speed).
it's done with requirements, let's start.
Our Solution
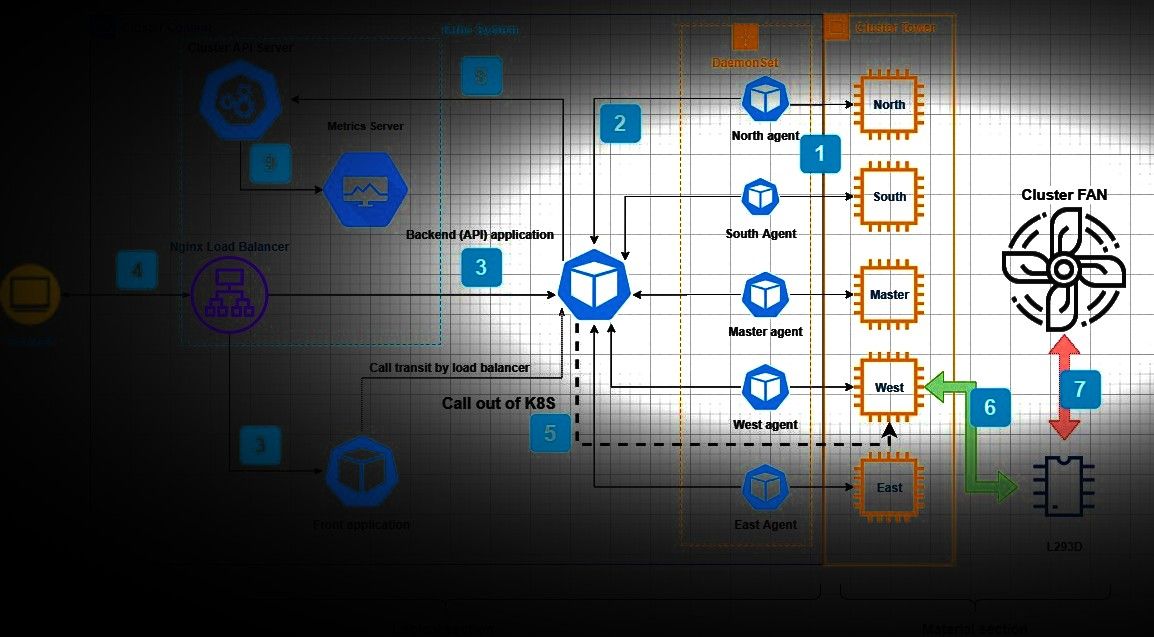
Global view
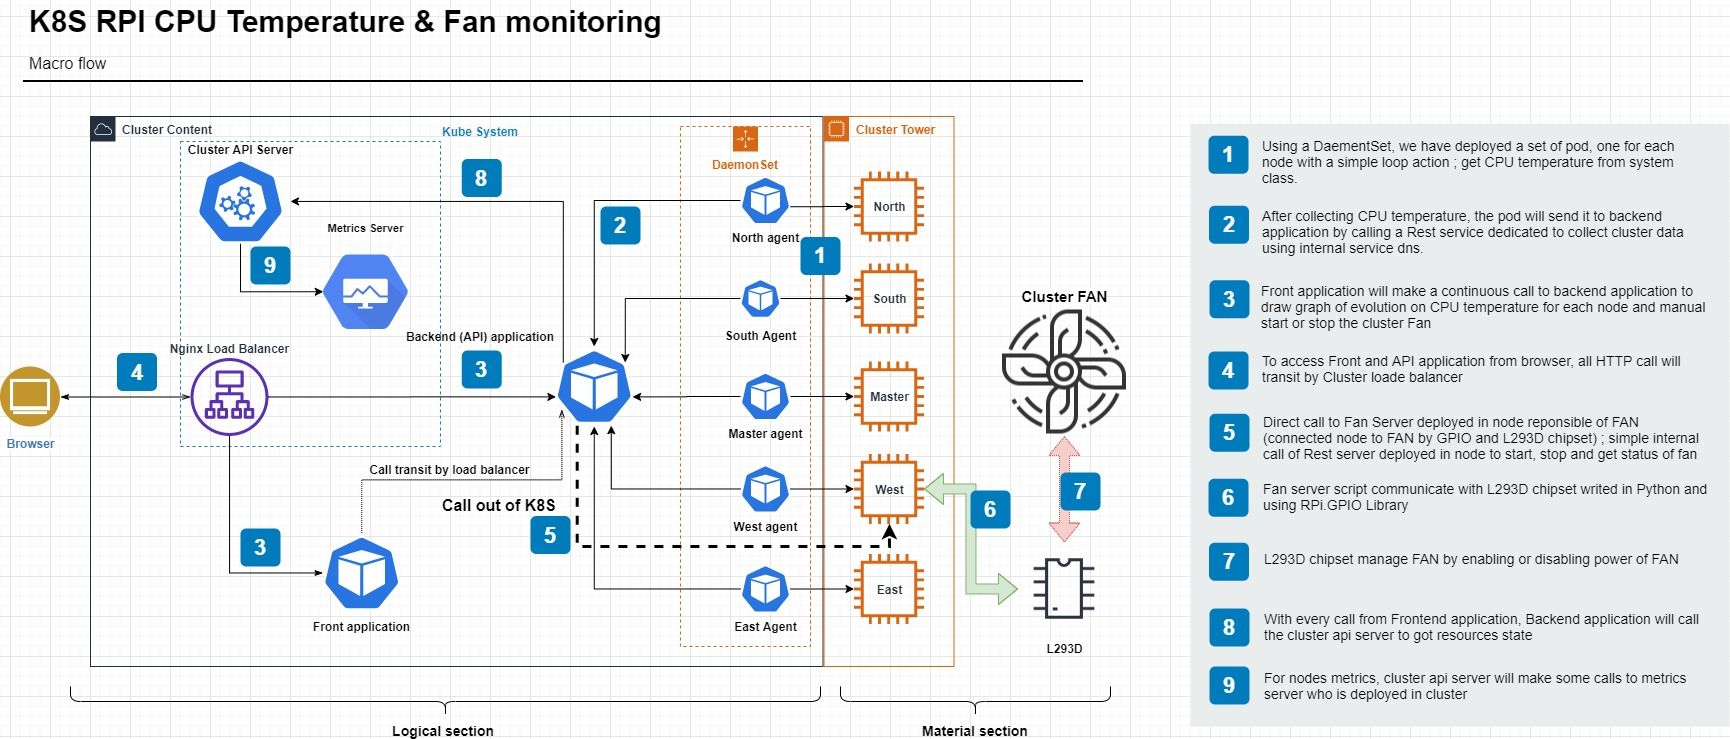
Our solution is composed by 2 section; logical and material section.
Logical section - Metrics Server
Start by deploy it
kubectl apply -f https://raw.githubusercontent.com/mmohamed/k8s-raspberry/master/kube/metrics.yamlIf success, you must have a new pod deployed
kube-system metrics-server-5d74 1/1 RunningLogical section - Application
For building and deployment, we will use Jenkins with a simple pipeline, more information available in this post.
To build application, we start by building the "webapp" module using Node, and the backend application using Maven to get an HTML web application and a Jar file.
For Frontend application, we will use a simple Nginx image and OpenJDK image for the backend.
Application can monitor 5 types of data;
Minimal Cluster Health

It's a minimal cluster health represented by the state of master node and will be appeared as badge of notification: it's can be "OK" or "KO".
Pods
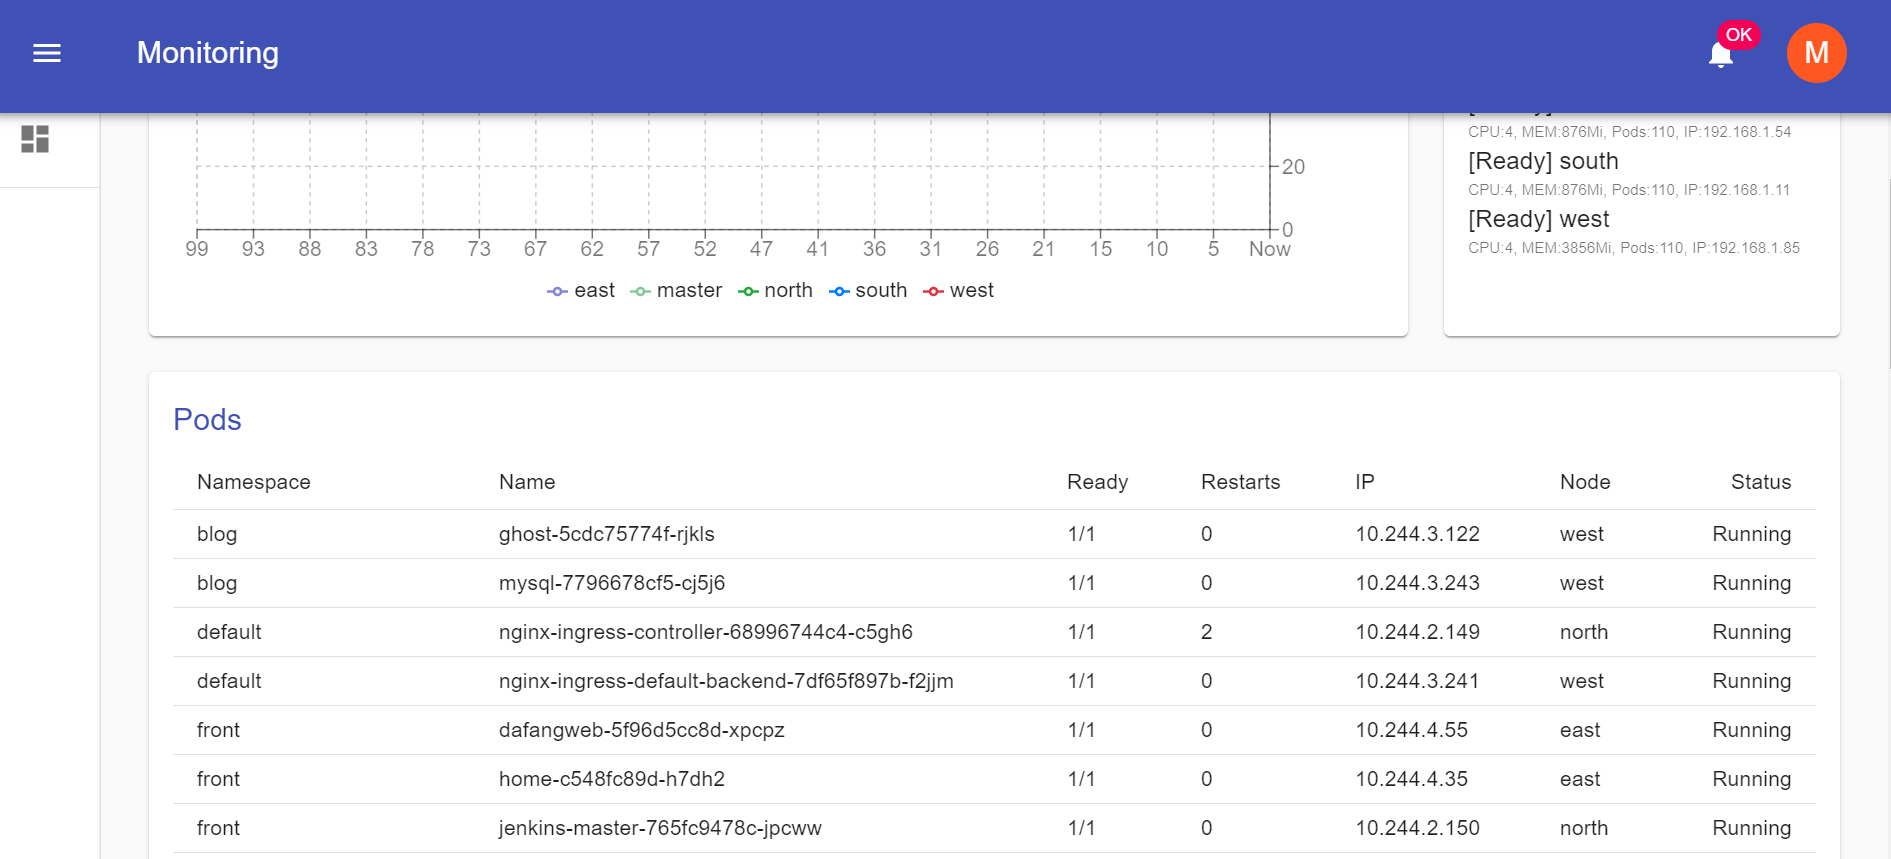
We will use the Kubernetes Client Java to call Cluster API Server by calling "listPodForAllNamespaces" method for pods listing view.
Nodes
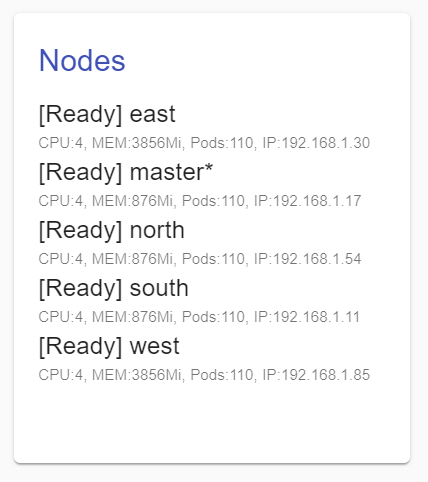
Like Pods data, we use "listNode" method to get nodes static information.
CPU & Memory usages
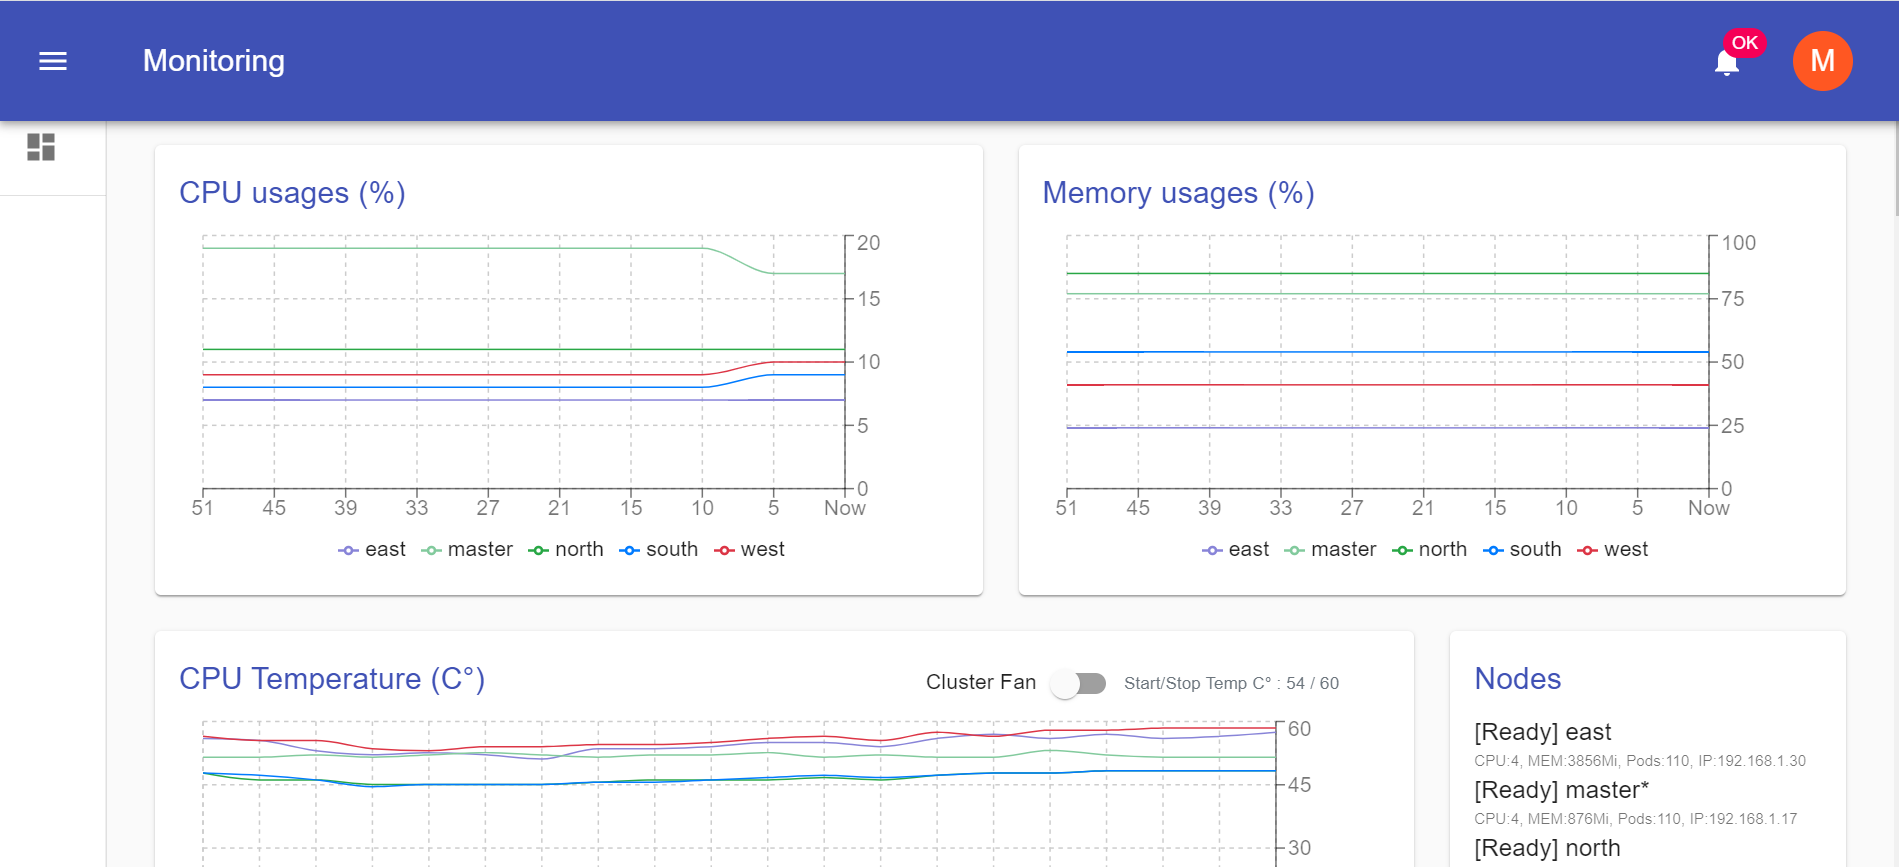
This data is only available with Metrics Server deployed, but standard Kubernetes Client don't have method or data structure to call metrics services.
We have created an extension of standard client to add "V1Beta1NodeMetrics" for metrics data representation. Then we have extended the client "CoreV1Api" to add new method "clusterMetrics" that they call service of Metrics Server on "metrics.k8s.io/v1beta1/nodes" path.
Extension source code are available here.
CPU Temperature
Standard Cluster metrics don't have CPU temperature of nodes as data, so we need to deploy sensors to collect them. We use a DaementSet to deploy a set of Pod to collect and send temperature values to Backend application.
apiVersion: apps/v1
kind: DaemonSet
metadata:
  name: monitoring-agent
  namespace: monitoring
  labels:
    k8s-app: monitoring-agent
spec:
  selector:
    matchLabels:
      name: monitoring-agent
  template:
    metadata:
      labels:
        name: monitoring-agent
    spec:
      tolerations:
      - key: node-role.kubernetes.io/master
        effect: NoSchedule
      containers:
      - name: monitoring-agent
        image: busybox
        env:
          - name: NODE
            valueFrom:
              fieldRef:
                fieldPath: spec.nodeName
          - name: SERVER
            value: http://monitoring-service.monitoring.svc.cluster.local/k8s/collect/{{token}}/temperature
        command: [ "sh", "-c"]
        args:
        - while true; do
            TEMP=$(cat /sys/class/thermal/thermal_zone0/temp);
            URL="$SERVER?node=$NODE&value=$TEMP";
            wget -qO- $URL;
            sleep 5;
          done;
        imagePullPolicy: IfNotPresent
For this sensor, we use a very small container (busybox) to make a continuous temperature collecting (every 5 seconds) and send it to Backend application using internal DNS service "monitoring-service.monitoring.svc.cluster.local" and a static security token "{{token}}" defined in the Backend app.
We have added a tolerance to deploy a replica of pod into "Master" node despite it's not schedulable.
monitoring-agent-6k7r4     1/1     Running   10.244.4.244   east
monitoring-agent-gzlc8     1/1     Running   10.244.2.181   north
monitoring-agent-hx9fx     1/1     Running   10.244.1.60    south
monitoring-agent-mtkf5     1/1     Running   10.244.3.28    west
monitoring-agent-znczc     1/1     Running   10.244.0.31    master
This data will not be saved anywhere, but only last sent for each node will be stored in a "ConcurrentMap" memory variable, defined in the Backend app and will be sent to Frontend app on Rest service calls.
Outside monitoring
To view and monitor any other system (RPi or not) from outside of K8S, you can use a small bash script with our application to send data
#!/bin/bash
# nohup sh agent.sh [NODE-NAME] [YOUR-SECURITY-TOKEN] > /tmp/agent.log
if [ -z "$1" ]; then
    echo "Node name required !"
    exit 1
fi

if [ -z "$2" ]; then
    echo "Security Token required !"
    exit 1
fi

attempts=0
server="http[s]://[YOUR-API-BACKEN-URL]/k8s/collect/$1/temperature"

while true; do

    temperature=$(cat /sys/class/thermal/thermal_zone0/temp)

    if [ $? != 0 ] || [ -z "$temperature" ]; then
        echo "Unable to determinate CPU temperature value !"
        exit 1
    fi

    url="$server?node=$2&value=$temperature"

    responseCode=$(curl --silent --output /dev/null --write-out "%{http_code}" $url)

    if [ $? != 0 ] || [ -z "$responseCode" ] || [ $responseCode -ne 200 ]; then
        attempts=$((attempts + 1))
        echo "[ATTEMP-$attempts] Failed sending data to server : $responseCode"
        if [ $attempts = 20 ]; then
            echo "Server response error after 20 attempts !"
            exit 1
        fi;
    else
        attempts=0
    fi

    sleep 5
done;
Logical section - Fan monitoring
To monitor Fan, Backend app expose 3 services; start, stop and get status of Fan by calling a micro Rest server deployed directly into West node (not with K8S).
We have used Python RPi library with Flask library to communicate with GPIO of West node and to expose some services like on, off and status of Fan by calling GPIO devices.
Starting by Installing libraries
apt-get install rpi.gpio
sudo pip install Flask # use sudo to install Flask bin into PATH
Server code source (replace NODE-FAN-IP by connected node to Fan)
from flask import Flask, jsonify
import RPi.GPIO as GPIO
import os, signal

GPIO.setmode(GPIO.BOARD)

IN1 = 11    # Input Pin 6
IN2 = 13    # Input Pin 7
ENABLE = 15 # Enable Pin 8

GPIO.setup(IN1,GPIO.OUT)
GPIO.setup(IN2,GPIO.OUT)
GPIO.setup(ENABLE,GPIO.OUT)

api = Flask(__name__)
api.config['SERVER_NAME'] = '[NODE-FAN-IP]:5000'

@api.route('/fan/status', methods=['GET'])
def status():
    status = GPIO.input(ENABLE) == GPIO.HIGH
    return jsonify({"status": status, "message": ("FAN ON" if status else "FAN OFF")})

@api.route('/fan/start', methods=['GET'])
def start():
    GPIO.output(IN1,GPIO.HIGH)
    GPIO.output(IN2,GPIO.LOW)
    GPIO.output(ENABLE,GPIO.HIGH)
    return jsonify({"status": True, "message": "FAN started"})

@api.route('/fan/stop', methods=['GET'])
def stop():
    GPIO.output(IN1,GPIO.HIGH)
    GPIO.output(IN2,GPIO.LOW)
    GPIO.output(ENABLE,GPIO.LOW)
    return jsonify({"status": True, "message": "FAN stopped"})

@api.route('/server/shutdown', methods=['GET'])
def shutdown():
    stop()
    os.kill(os.getpid(), signal.SIGINT)
    # not sended
    return jsonify({"status": true, "message": "Server is shutting down..." })

if __name__ == '__main__':
    api.run()
    GPIO.cleanup()
And run the server
nohup sudo python server.py > /tmp/fan-server.log &Now, we have a Fan server deployed and available only inside cluster (not exposed to outside of LAN). If you want deploying this server using a Pod, it's must privileged Pod (can access to host devices) and you must mount all GPIO devices (available into /dev) to pod with same name and path but it's not guaranteed to work.
Server will be explained into "Material section".
Now, to say to Backend app where it's can pilot fan, we add an environment variable to Backend deployment "FAN_SERVER_URL" and it must be like "http://192.168.1.1:5000". In this way, the switch can make Fan on and off.
The second feature is to make our Backend app run in auto-mode to start Fan when maximal temperature is reached and stop Fan when minimal temperature is reached. To do this, we must specify a maximum value with an environment variable to Backend app "FAN_MAXTEMP", and Fan will be on when any node will have a temperature great than this value and will be off when the maximum temperature of all nodes will be less than 90% of this value.

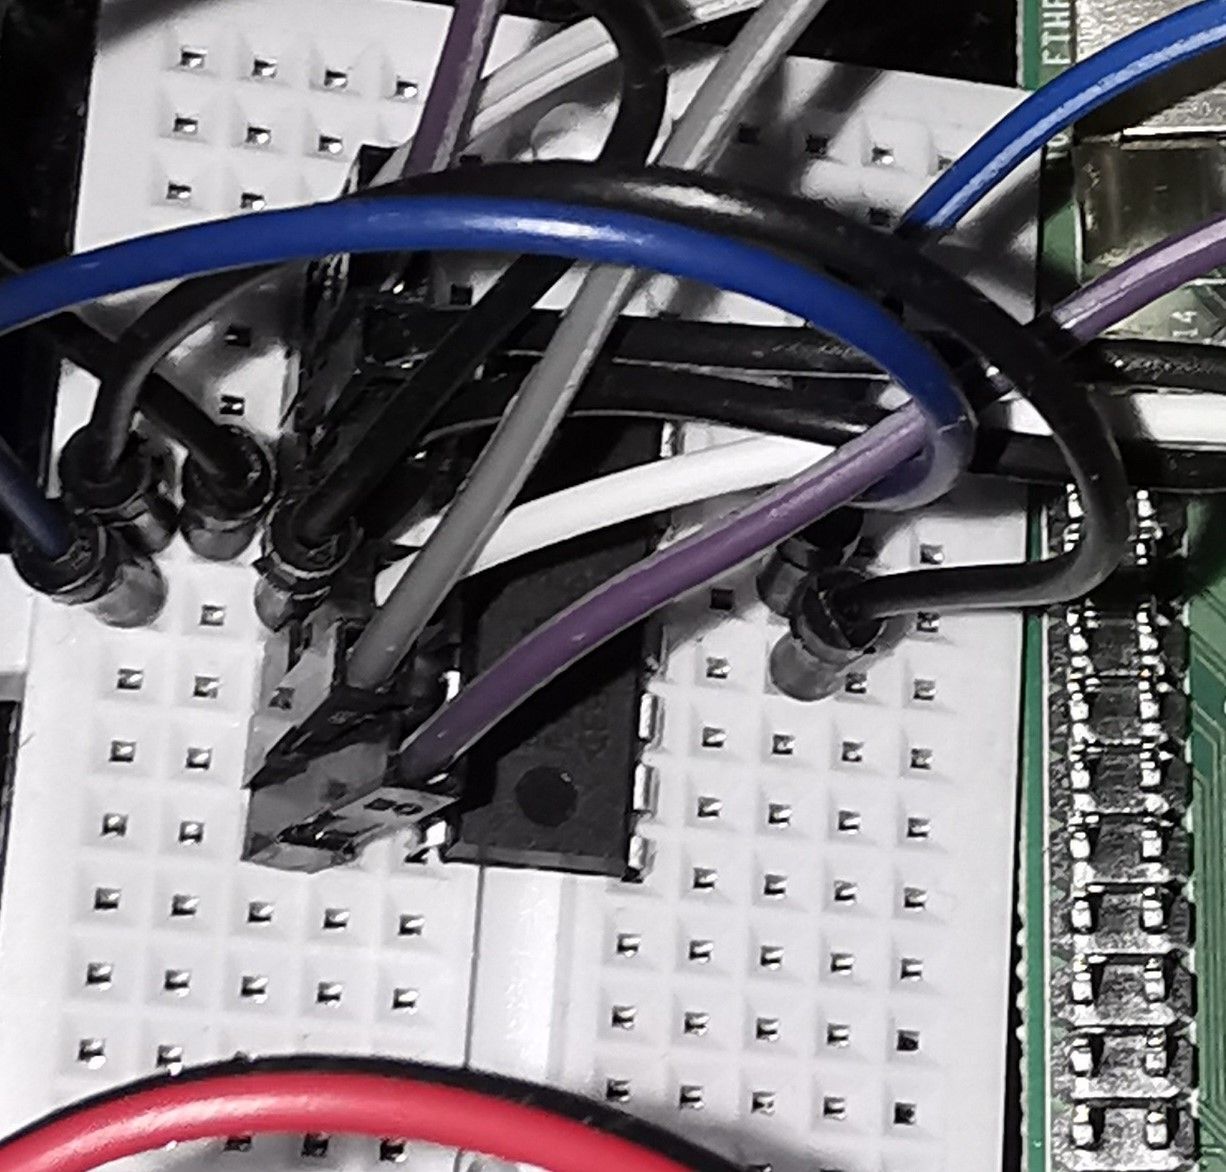
Material section - L293D
To make fan manageable by RPI, we will use a L293D chipset
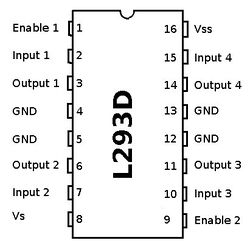
We will use a first half part of chipset, so we connect "Input 1" to RPi PIN 11, "Input 2" to RPi PIN 13 and "Enable 1" RPi PIN 15.
PIN 15 is to enable or disable motor management and PIN 11 & 13 is for rotation direction of motor setting. We will power chipset by RPi 5v and in our case we will use same power source to power motor (it's not good idea but it's faster to make it's run). After we will change it by another stable power 5V.
The Fan server play with GPIO output PIN to start and stop Fan, and it's can read state of GPIO to know if the Fan is in run mode or not in all cases.
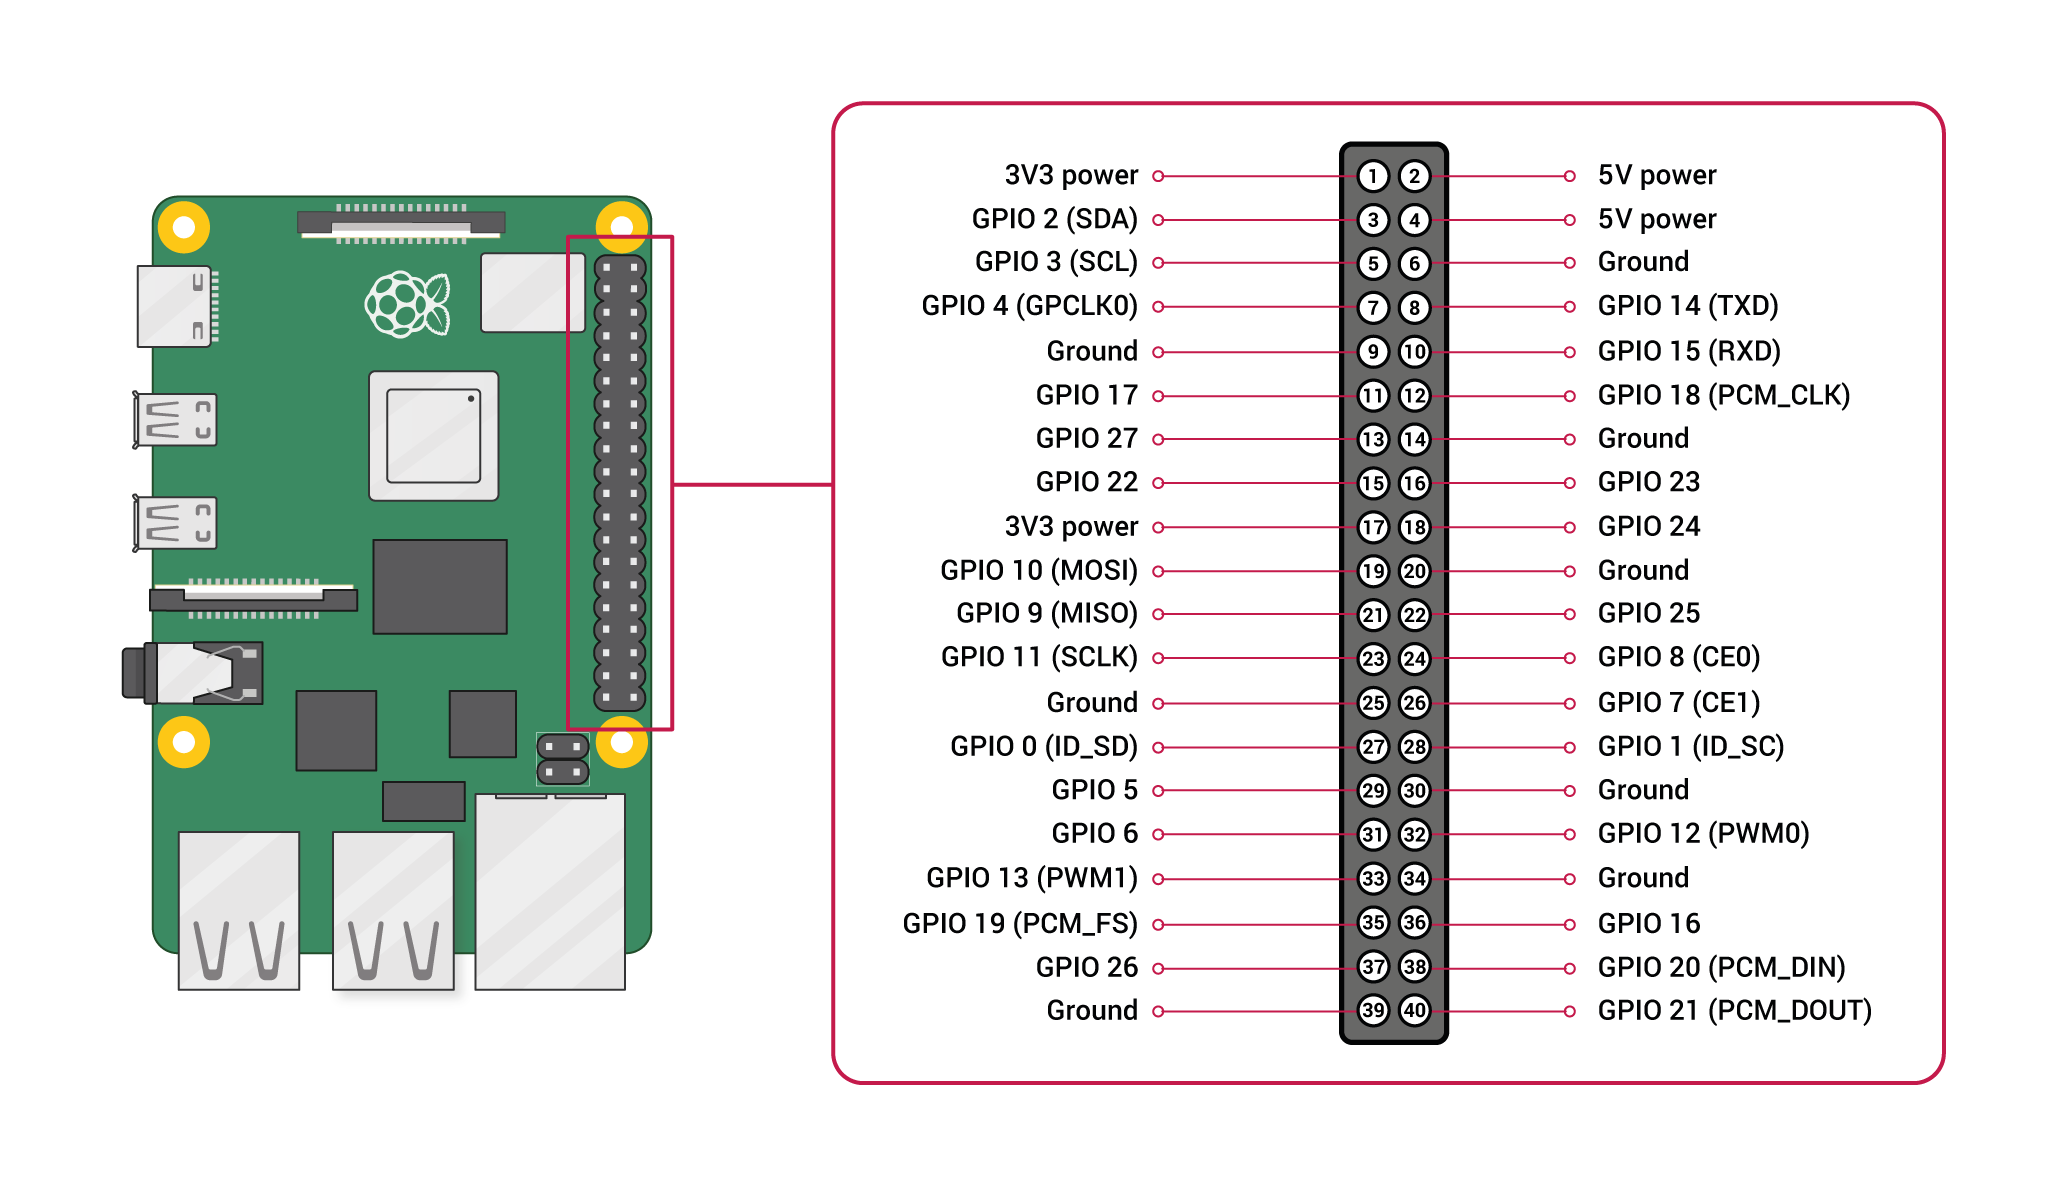
PIN connection result:
RPi PIN    L293D PIN
11         2
13         7
15         1
4          16
6          4/5
2          8 # should be another PWR source
NAN        3 # Motor +
NAN        6 # Motor -
Nota: you can use another GPIO PIN 11, 13 and 15 if you want but you must adjust server code in PIN declaration section.
To test connection and fan server, we can use a simple Curl command
curl http://[FAN-CONNECTED-NODE-IP]:5000/fan/start
curl http://[FAN-CONNECTED-NODE-IP]:5000/fan/status
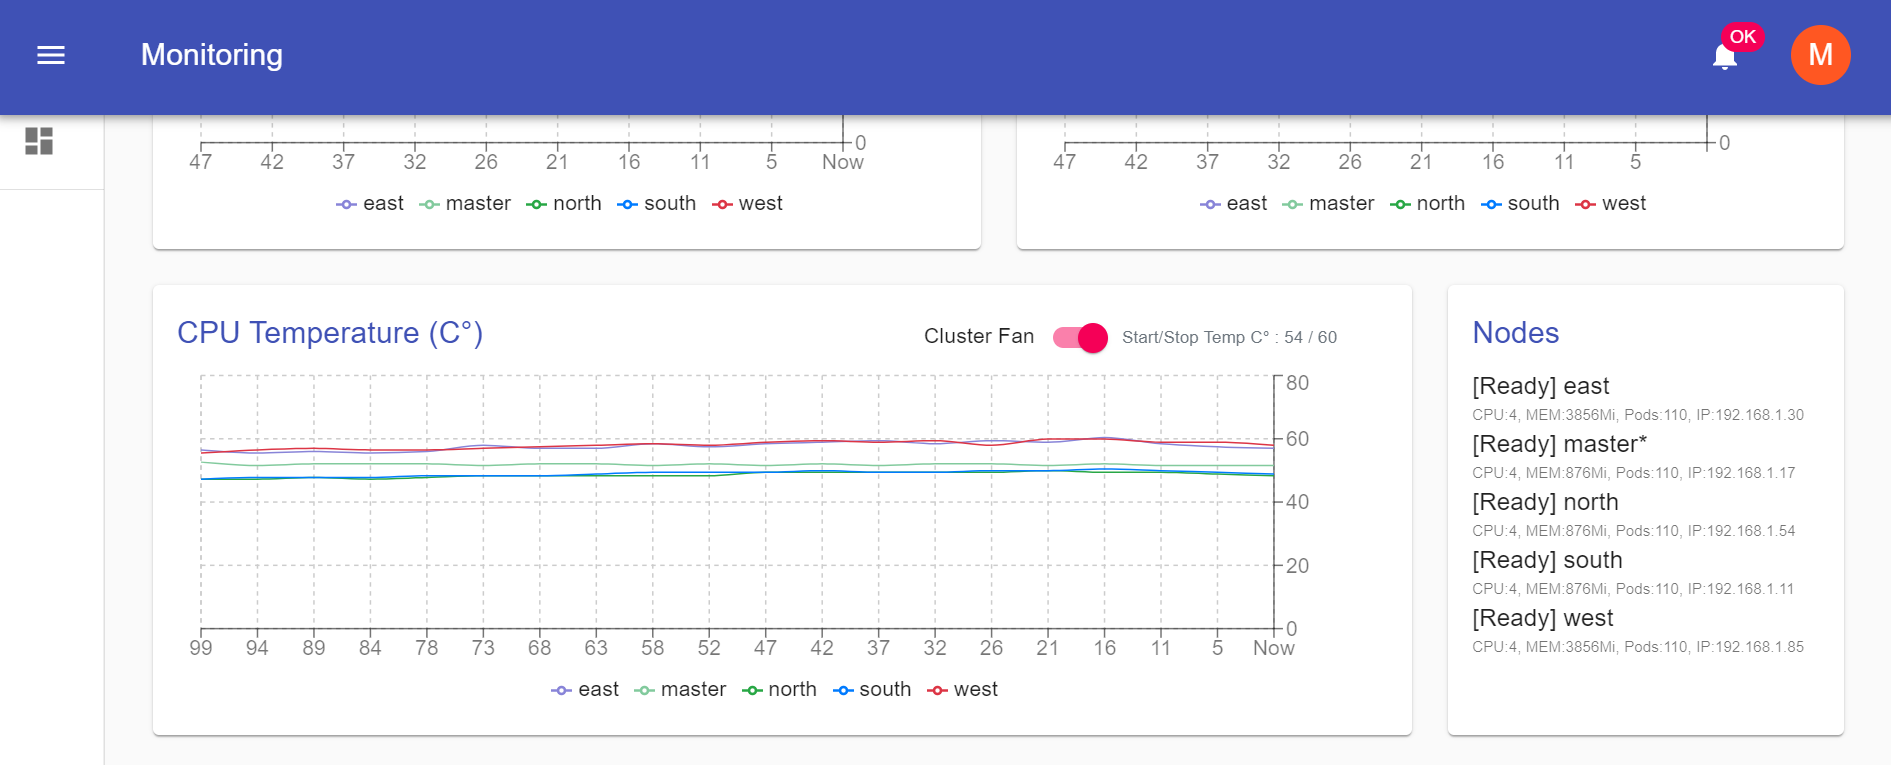
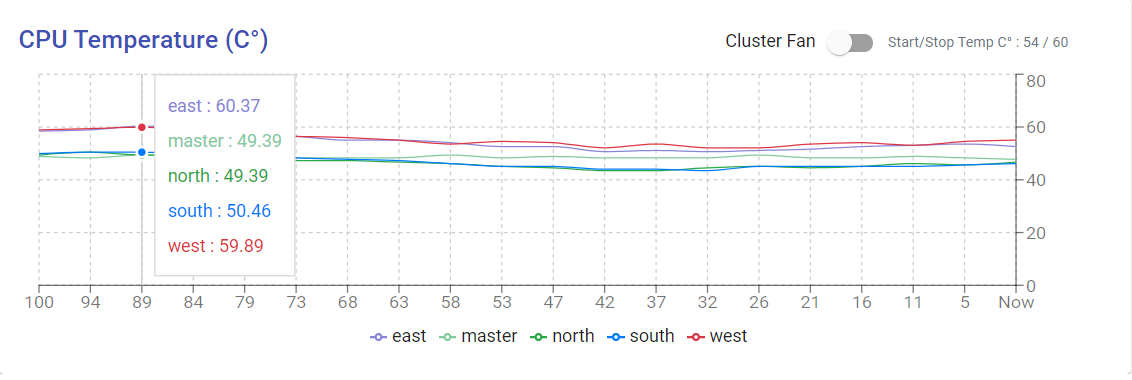
curl http://[FAN-CONNECTED-NODE-IP]:5000/fan/stopWhen all is done, you can see the fan status in Web view with fan switch status (on/off) and you will see temperature chart evolution. When 60C° value reached, Fan will start, and chart will come down to 54C°.
Start state
And stop state
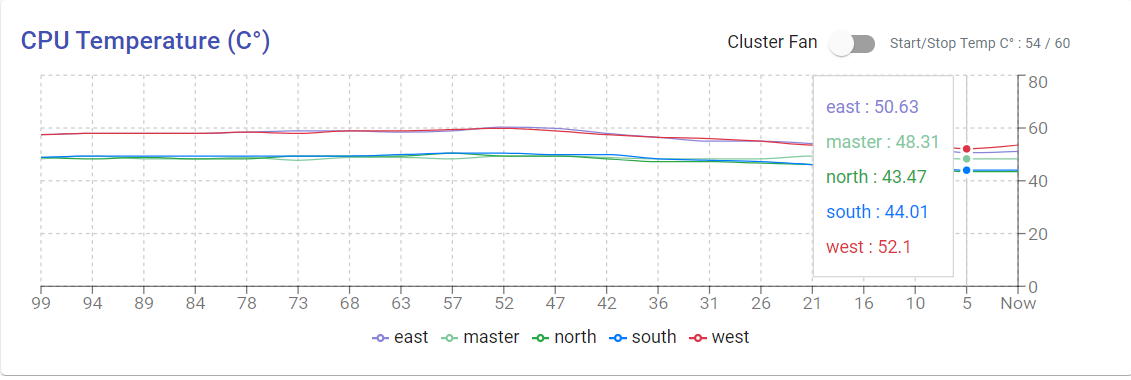
We can start or stop manually the cluster fan by using the Web view switch.
Realtime monitoring
See how auto-managing fan work.
It's done, enjoy :)